|
|
1 week ago | |
|---|---|---|
| dockerfiles | 1 week ago | |
| files | 1 year ago | |
| .dockerignore | 2 years ago | |
| .gitignore | 2 years ago | |
| LICENSE | 5 years ago | |
| Makefile | 2 years ago | |
| README.md | 1 year ago | |
| docker-compose.yaml | 1 week ago | |
| release.sh | 1 year ago | |
README.md
docker-wownero
Simple way to run a Wownero node with some basic monitoring tools packaged in.
Leverages Prometheus, Grafana, nodemapper, and monero-exporter on top of wownerod.
Setup
The only requirements are Docker and Docker Compose. Ensure those are installed on your system. There's an optional Makefile provided if you'd like to use that, just ensure make is installed.
# Clone and enter the repository
git clone https://git.cloud.lzahq.tech/nerodev/docker-wownero
cd docker-wownero

# OPTIONAL: Setup Grafana password, blockchain storage location, or port and container image tag overrides
cp env-example .env
vim .env

# Build containers
docker-compose build  # make build
The following ports will be bound for wownerod by default, but you can override in .env:
- 34567 # p2p
- 34568 # restricted rpc
- 34570 # unrestricted rpc
The following ports are commented out but can be enabled to test things locally:
- 9090 # prometheus web ui
- 3000 # grafana web ui
- 9000 # exporter web api (/metrics)
- 5000 # nodemapper web api (/metrics)
You will want to open/allow ports 34567 and 34568 in your firewall for usage as a remote/public node (or whichever p2p and restricted ports you picked).
Also, you may want to setup a reverse proxy to Grafana if you would like to expose the visualizations for the world to see. Be sure to lock down the administrative settings or leave login disabled!
Usage
It's fairly simple, use docker-compose to bring the containers up and down and look at logs.
# Run containers
docker-compose up -d            # make up

# Check all logs
docker-compose logs -f

# Check monerod logs
docker-compose logs -f monerod  # make logs
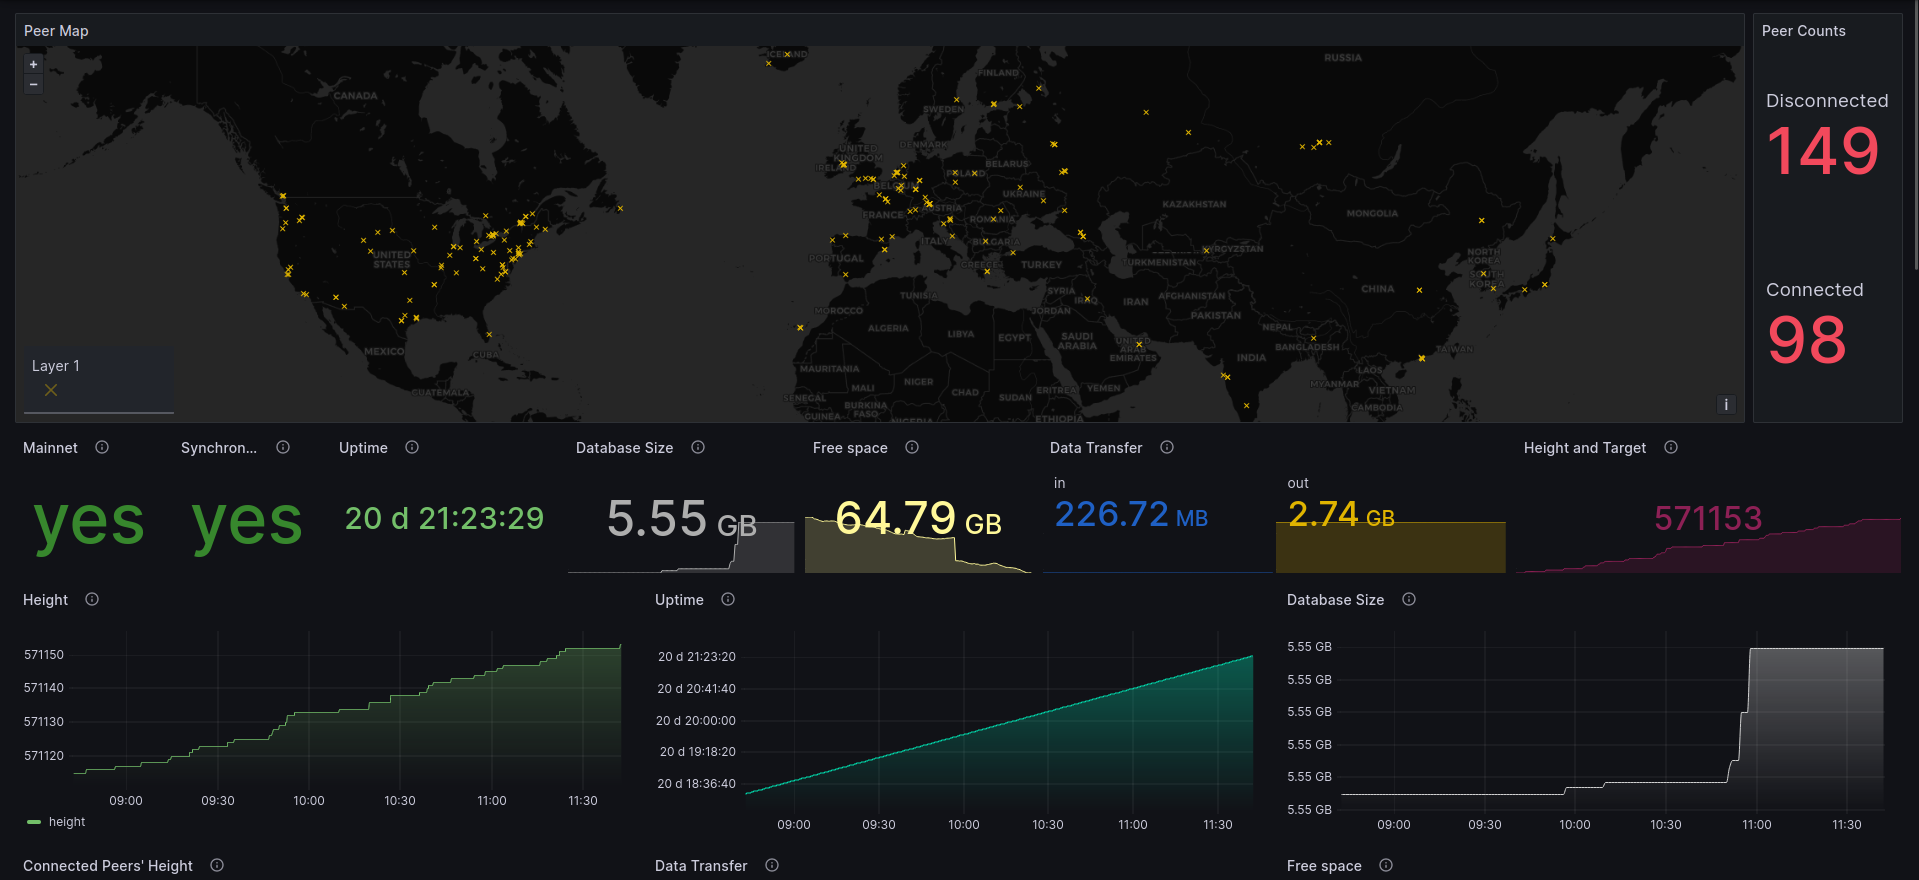
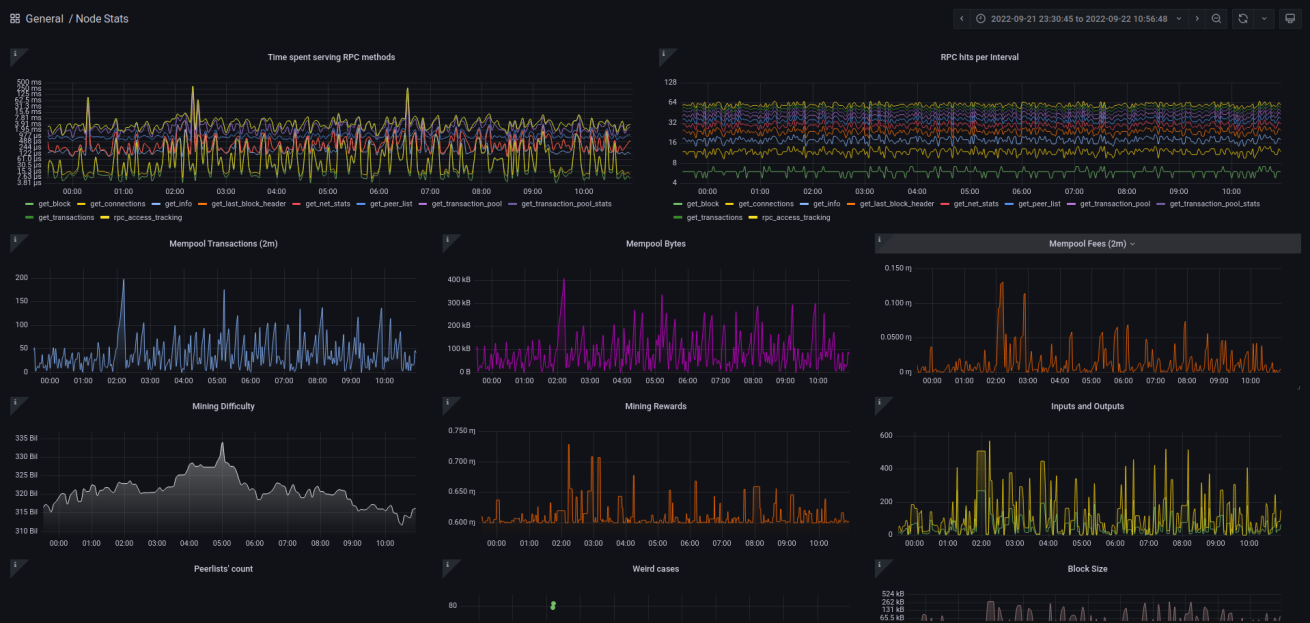
Navigate to http://localhost:3000 and log into Grafana. Find the Node Stats dashboard to get those sweet, sweet graphs.
If you've installed this on another system you will want to use SSH tunnels (local forwarding) to reach Grafana (if not exposing via reverse proxy):
ssh <VPS OR SERVER IP> -L 3000:localhost:3000
Then navigate to http://localhost:3000. Here is what the graph looks like: